Chapter 3:              Calcium Clusters


3.1        Background


Metallic clusters have been the subject of intense interest in recent years [19,20]. Calcium is a very abundant metal that plays an important role in a variety of compounds, mechanisms, and processes.  This element is of interest because of its potential use in excimer lasers, carbon-chemical engineering, and ion deposition. Despite its popular chemical usages, only a limited number of experimental observations for pure calcium clusters [21] have been reported. Calcium belongs to the group-IIA alkaline-earth metals with closed-shell electronic configuration, [Ar] 4s2. The bonding in the bulk quasi-metal is quite strong with a cohesive energy of 1.825 eV. In contrast, the Ca2 molecule presents a weakly bound ground state with dissociation energy of only 0.14 eV and strongly bound excited states [22]. The discrepancy in the bonding behavior at the two size limits, bulk and dimer suggests that a change in the bonding must take place as a function of cluster size.

One property of small metallic clusters that has received little attention is their vibrational spectra.  Recently a detailed theoretical investigation of the harmonic vibrational frequencies of Rh2 through Rh6 using density functional methods and large basis sets [23] has been reported. For small calcium clusters there have been very few ab-initio calculations that include electron correlation effects or report vibrational frequencies: Ca2 [24–26], Ca3 [27], Ca4 [26-30], and Ca5 [26]. For larger calcium clusters there are no first principles calculations, although there have been attempts to


model the cluster geometries with the empirical potential of Murrell and Mottram (MM) [31-33] that has two and three body interactions.   The results of the calcium cluster study in the thesis has been published by J. Mirick et al. [34]


In this chapter we perform an exhaustive all-electron study within the DFT framework and the GGA of calcium clusters containing up to 13 atoms. Results are presented in Section 3.2 for the calcium dimer including a thorough comparison between various calculation methods. The energetics, vibrational frequencies, and thermodynamic properties in the harmonic approximation for Ca3 through Ca13 are described in Section 3.3.  This section also discusses several isomerization reaction paths and report several cluster structures corresponding to saddles of the energy surface.   A thermally induced structural transition for Ca12 is highlighted in this section.   The study will help us gain insight in to the models and mechanisms that bring atoms together to form condensed matter.


3.2        Computational Methods


The Kohn-Sham equations [2] were solved self consistently using the GGA representation of the correlation functional.  The Becke’s three-parameter hybrid method [7] was used in the study of calcium clusters, as described in Chapter 2.  The hybrid method includes the Hartree-Fock exchange and local and non-local terms to the correlation functional provided by Perdew-Wang [9,10].  A triple split valence basis set, 6-311g(d), was used in all calculations involving the calcium atom, i.e. calcium clusters and CaCO3 clusters (see Table 2.1).  We found the basis set to be sufficiently large to give good results at a reasonable computational effort. Adding an additional diffuse function produced insignificant changes in both the energy and bond length of Ca2. 

Based on the dimer results, all calculations reported in this study of calcium clusters were performed using the triple valence basis set with the addition of a d polarization function. Results in forthcoming sections do not include the Basis Set Superposition Error (BSSE) [35] correction. However, we did test for BSSE with calculations up to Ca4 and found an insignificant decrease in the total energy for these cluster sizes. Worth noting is that BSSE is important when the basis set is small, and our basis set is large.


3.3        Calcium Atom and Dimer


3.3.1   Ionization Potential


One way to characterize the various methods and basis sets used in computational chemistry is to compare the results of the calculations with experiments.  Experimental results of the interactions between calcium atoms are somewhat limited to the ionization potential of the calcium atom, the dissociation energy of the calcium dimer, and the equilibrium interatomic distance in the calcium dimer.  Although calcium clusters have been observed in experiments, there is still a lack of results regarding the properties of calcium clusters.  The ionization potential (IP) for the monatomic calcium is known but the ionization potential (IP) for the calcium dimer has never been measured or calculated.   The article by Hansen et. al. [36] suggests that the IP for the calcium dimer should be slightly less then IP for the calcium atom.

The ionization potential for the calcium atom and dimer (the energy required to remove one electron) can be defined by


                                                (3.1)


The energy required to remove two electrons is


                                  (3.2)


A comparison of different methods was made in the calculation of the ionization potential for both the calcium atom and the calcium dimer.  The results of the calculations are summarized in Tables 3.1 and 3.2.   For Ca+ we find from the table that the purely density functional method (PW91PW91) gave the best agreement with the experimental value with a percent difference of 0.03%, while the B3PW91 also gave close agreement.   The MP4 method had the largest difference with a percent difference of 3.1%.  All methods performed well in the calculation of the ionization potentials for the singly ionized calcium.


Table 3.1:  The single and double ionization potentials of the calcium atom using different methods with the 6-311g(d) basis set. 


Method

I  ( eV)

II (eV)

MP4(sdq)

5.926

17.601

B3PW91

6.006

17.883

PW91PW91

6.115

18.124

Experiment

6.113

17.985


Table 3.2:  The single and double ionization potential for the calcium dimer using different methods with the 6-311g(d) basis set.  


Method

I (eV)

II (eV)

MP4(sdq)

5.158

14.130

B3PW91

4.950

14.068

PW91PW91

4.990

14.166


For the doubly ionized calcium we have a less then 1% difference for both the B3PW91 and the pure density functional methods (PW91PW91).  These are the two methods that performed best overall for both the singly and doubly ionized calcium atom.


3.3.2   Dissociation Energy


Experimentally the properties of the weakly bonded Ca2 dimer have been extensively investigated [22,36-39].   The results of most interest in this work include the experimental observations by Vidal [22] of the dissociation energy, the equilibrium interatomic distance, and the harmonic frequency.

The binding energy of the calcium dimer is found by determining the difference between the total electronic energy of the calcium dimer and twice the total electronic energy of the calcium atom and a “ghost” atom placed at the same interatomic distance as the calcium dimer.  This allowed me to include the Basis Set Superposition Error Correction (BSSEC) in calculations involving the calcium dimer.  The equation for the binding energy is


                                           (3.3)


Where Eb is the binding energy, E(Ca) is the quantum mechanical results with one atom and one ghost atom (BSSEC), and E(Ca2) is the quantum mechanical results from the calcium dimer.  When the 6-311g(d) basis set was used in the calculation, the BSSEC was found to be small.

Table 3.3 compares previously published results with my results obtained using B3PW91/6-311g(d).   From the table we can see that my values for the dissociation energy, equilibrium bond distance, and harmonic frequency agrees well with the experimental values of Vidal [22].  Many of the previously calculated results significantly underestimated the dissociation energy.   In 1979 Jones [24] used a LDA method to arrive at a value of 0.2 eV for the dissociation energy, which is higher than the experimental value of 0.136 eV.  The value I found was 0.144 eV, which is slightly higher than the experimental value.


Table 3.3:  Summary of energy, vibrational frequency, and equilibriated interatomic distance for the calcium dimer from my work and previously published results.


Energy (eV)

Frequency (cm-1)

R (Å)

B3PW91/6-311g(d) This work

0.144

72.29

4.269

NRLMOL

0.201

76.0

4.300

Experimental

Vidal [22]

0.136

65.0

4.277

Experiment

Balfour [37]

0.133

64.93

4.28

Full CI / [4s2p1d]

Pacchioni [28]

0.029

---------------

5.080

Full CI / [4s2p]

Pacchioni [26]

0.007


6.509

SCF-LCAO / [4s3p]

Stoll [25]

0.012

----------

5.503

DFM w/ LDA

Jones [24]

0.20

80

4.297


In the NRLMOL software package we used 19 non-contracted gaussians augmented by three floating gaussians to expand each of the ‘s’, ‘p’, and ‘d’ orbitals that were optimized on the calcium atom.

Since Ca2 is a closed-shell system, it demands a good representation of the electron correlation energy to obtain reasonable total energies. I performed an analysis using different methods on the calcium dimer, which are summarized in Fig. 3.1, where the binding energy (Eb) is displayed as a function of interatomic distance (R). The binding energy is computed as the difference between the total energy of two isolated Calcium atoms (with the BSSE correction) and the total energy of the dimer. The red line shows results using the HF method.  The green curve represents the fourth order Moller-Plesset.  This method includes single, double, triple, and quadruple substitution (or excitations), abbreviated MP4(SDTQ) [12].  The black curve represents the B3PW91 method.  The density functional method, PW91PW91 (magenta), includes a local exchange, given by Slater, the non-local exchange provided by Perdew and Wang91, and the local and non-local correlation functional which are also provided by Perdew and Wang.  All calculations were done using Gaussion98 [40].  The accuracy attained in the self-consistent field (SCF) process assures eight decimal places in the energies.


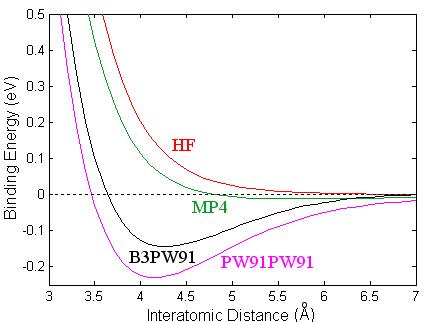
Figure 3.1:  Binding energy of Ca2 as a function of interatomic distance using different methods: HF (red), MP4 (green), B3PW91 (black), and density functional PW91PW91 (magenta).


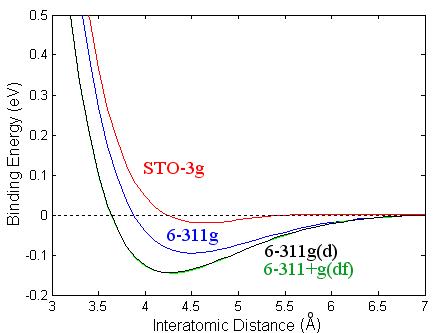
Figure 3.2:  Binding energy of Ca2 as a function of interatomic distance using different basis sets: STO-3g (red), 6-311g (blue), 6-311g(d) (black), and 6-311g+g(df) (green).


The same basis set, 6-311g(d) was used in the whole analysis.   The HF method is clearly inadequate for describing the calcium dimer since the method results in an unbounded system, and from experiments we know that the system is bounded.  That is, the force is purely a repulsive interaction between the two atoms at this level of approximation.   It is apparent that the electron correlation will need to be included in any study of calcium systems.   In the MP4 calculation the calcium dimer is marginally bounded, having small dissociation energy.  This method is inadequate at including the effects of the electron correlation energy resulting in a substantial underestimation of the dissociation energy, while the density functional method overestimates the binding energy.   The PW91PW91 results are very close to the early LDA results of Jones [24].  The dissociation energy found with B3PW91 (black line) is 0.144 eV, in good agreement with the experimental results of 0.136 eV [22]. In addition, we found a value of 4.269 Å for the equilibrium bond length, which compares well to the experimental value of 4.277 Å. Our predicted harmonic frequency is 72.3 cm-1, also in good agreement with the experimental results. Such low frequency gives a zero point energy correction to the binding energy of 0.2 kcal/mole. Previous calculations for the dimer have reported significantly different binding energies and interatomic distances.

I have shown that MP4 configuration interaction calculation does not include a large enough set of configurations to account for the electron correlation energy in the calcium dimer. The HF description of the electron exchange energy in Ca2 provided by B3PW91 is superior to the functional representation of that energy in PW91PW91. The agreement between the B3PW91 calculations and the experimental values of the binding energy, bond distance, and harmonic frequency for the calcium dimer led us to the hybrid method B3PW91 in our investigation of larger clusters.
  I have also looked at different basis sets using B3PW91, see Fig. 3.2, and have found that the triple split valence basis set, 6-311g(d), gave the best result.

A fit of the B3PW91/6-311g(d) energy curve in Fig. 3.3 was made to three potentials; the Lennard-Jones Potential (Eq. 3.4), Mie-Jones Potential (Eq. 3.5), and the Morse potential (Eq. 3.6).  The fit was performed over an interval 3.3 to 5.3 Angstroms, which is approximately 1 Angstrom either side of the minimum (4.27 Å).   It was felt that this interval would give the best representation in the region of interest.


                                                        (3.4)


                                                        (3.5)


                                               (3.6)


The values for the parameters are listed in Table 3.4 for the three potentials.  The parameters for the Morse potential, which gave the best fit to the ab-initio calculation, was found to be De= 0.139140 eV, b=1.093, and r0=4.261 Å, as seen in Table 3.4. The error of the fit was 0.005 eV. The harmonic frequency and anharmonic constant obtained from this Morse potential are we = 68.85 cm-1 and wexe = 1.06 cm-1, respectively. These values are in excellent agreement with those obtained from spectroscopic measurements [22,36,37].  The following was used [41]:


       (3.7)

and

                                                   (3.8)

From the result of Eq. 3.7 and using Eq. 3.8, the harmonic frequency of the calcium dimer was found to be 68.9 cm-1, which is in good agreement with previously published results of 65 cm-1.  Vidal [22] found a value for the Dunham’ coefficient of Y’’20 = 1.081 cm-1.  This value is approximately equal to the anharmonic constant and agrees well with my calculation of 1.056 cm-1.

For comparison purposes, I modeled the results of the binding energy calculations for the calcium dimer, using the B3PW91/6-311g(d) method and basis set, to various model potentials.  A plot of these model potentials and my calculated values for the binding energy are shown in Fig. 3.3.  The Morse potential (black), Lennard-Jones potential (Blue) and the Mie-Jones potential (Red) were fitted to the data points (‘x’ marks) using a non-linear least-square fit. 


Figure 3.3:  The data from the B3PW91/6-311g(d) method (‘x’ marks) was fitted to the Morse Potential (black), Lennard-Jones Potential (Blue) and the Mie-Jones Potential (Red) using a non-linear least-square fit.  The interval for the fit was from 3.3 to 5.3 Angstroms, which is approximately 1 Angstrom either side of the minimum (4.27 Å).


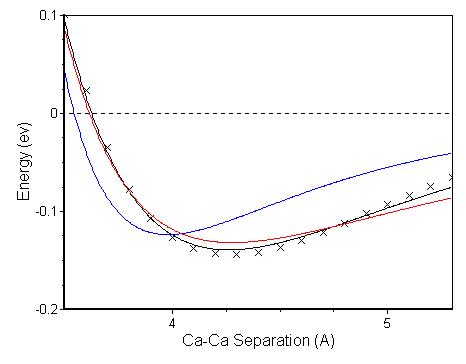
Table 3.4 Optimized parameters to the ab-initio calculation of the calcium dimer for different model potentials. 


Parameters

Standard Deviation

Lennard-Jones

e = 0.123570 eV    s = 3.545893 Å

 0.0416 eV

Mie-Jones

a=3.374498 Å  b = 3.173516 Å

m = 8.045927  n = 4.262902

 0.0110 eV

Morse

b = 1.093225 Å-1  De = 0.139140 eV

 r0 = 4.261099 Å

 0.00496 eV


Harmonic Frequency Calculations

3.4                Calcium Clusters


3.4.1   Stable Isomers


The search for minimum energy structures began by using as input optimized structures from the Mottram-Murrell potential (MM) [32] and structures that were in our database of structures.   The MM potential is a model potential where the parameters are fitted to the potential in such a way to describe the material properties of calcium.  The potential is the sum of both two-body and three-body interactions between atoms in a cluster, as defined by


                                       (3.9)


The two-body interaction is defined by


                        (3.10)


where ‘D’ is the dissociation energy for the diatomic molecule, ‘b’ is a parameter,  and ‘re’ is the equilibriated value for the distance.  The three-body interaction is defined by


                        (3.11)


The quantities ‘P’ and ‘Q’ and the optimized values for the parameters are defined by J. N. Murrell and R. E. Mottram [31].

The geometries in our study were optimized without symmetry constraints and the ground state of all clusters were singlets. The SCF calculations and geometric optimization had an energy convergence criterion of 10-7 atomic units.  Table 3.5 lists the binding energy per atom, ‘Eb’, average bond length, ‘Rave’, and normal mode frequencies. In this table, as well as in the rest of this paper, binding energies at the minima are reported as positive values.   For comparison, the table also includes previously published results for these cluster sizes.

The ground-state configurations are the equilateral triangle (D3h) for Ca3, the tetrahedron (Td) for Ca4, and the trigonal bipyramid (D3h) for Ca5. Other geometries of the trimer and tetramer were also studied, as listed in Table 3.5. Previous calculations performed on Ca3 (equilateral triangle) and Ca4 (tetrahedron) [27] revealed a binding energy of 0.162 eV/atom and 0.341 eV/atom, respectively. Both values underestimate the binding energy as compared to our results by 30% and 26%, respectively. Reported bond lengths for the trimer and tetramer from Ref. [27] are 4.172 and 4.016 Å, respectively. These bond lengths are higher than our values of 3.933 and 3.767 Å. The pentamer is the characteristic trigonal bipyramid of close-packed structures. Reported binding energies [26] are much lower than our results, and the corresponding bond lengths longer than our values (see Table 3.5). Even though there are reported calculations for other geometries of Ca4 and Ca5 [26], these were not listed since they were not minimums of the energy surface. In fact, we found that most of these structures are associated with saddle points of the energy surface.   When I compare the results using the B3PW91 method with the results of NRLMOL [42], we see that the binding energies appear to be in close agreement.  However, the interatomic distances are significantly higher in NRLMOL than in B3PW91.   In the NRLMOL software package we used 19 non-contracted gaussians augmented by three floating gaussians to expand each of the ‘s’, ‘p’, and ‘d’ orbitals that were optimized on the calcium atom.

No ab-initio calculations had been reported on cluster sizes having more than five atoms before my work.  From Table 3.5 we can see that the values for the binding energy per atom in the literature was significantly less than the values found in my work, with the exception of Jones [24].   The reason for this is that the other scientists did not adequately account for the electron correlation and the basis set was inadequate for the calcium atom.   In general, the minimum energy structures found in my work are more compact structures than those from the work of others, as seen from the equilibriated distances of the nearest neighbor.  

In Table 3.5, it is apparent that for the trimer and tetramer, a good treatment of both correlation and exchange energies is crucial. Not only binding energies are higher in my study than previously reported in the literature, but also the bond lengths are significantly smaller, giving a more realistic representation of these clusters.

All minimum energy isomers, Ca2 through Ca13 that we found in our search are listed in Table 3.6 with their point group classification, binding energy, smallest bond distance and average “nearest neighbor” bond distance.   Their corresponding geometries are shown in Fig. 3.4a, 3.4b, and 3.4c.

The closed packed growth sequence which leads to five fold symmetry clusters is obtained from Ca3 through Ca9, namely, decorating a face of the tetrahedron (Ca4) with one atom leads to Ca5 (trigonal bipyramid), Ca6 (trigonal bipyramid with one decorated face) is the pentamer, the pentagonal bipyramid is the geometry for Ca7, the heptamer becomes Ca8 (pentagonal bipyramid with one decorated face), and Ca9 (pentagonal bipyramid with two decorated faces) is the heptamer.  The growth sequence changes at Ca10, which is the atom centered anticube with an extra atom decorating a square face, and has four-fold symmetry.  The four-fold axis of rotation is preserved for the lowest energy structure of Ca11 as can be seen in Fig. 3.4c. It is also apparent from this figure that from Ca11 and up, a secondary structure with twinned pentagonal bipyramids is close in energy to the global minimum structure.  The second from the lowest energy structure of Ca11, a twinned pentagonal bipyramid, becomes minimum energy structure of Ca12 with the addition of an atom.   This is the beginning of a new growth sequence leading to the minimum energy structures for Ca12 and Ca13.


Table 3.5: Binding energy, average nearest neighbor distances, and normal mode frequencies for Ca3 through Ca5.


Sym

Eb (eV/Atom)

Rave (Å)

Frequency  (cm-1)

Ca3

D3h

0.220 (B3PW91)

3.933

98.8 (E'), 107.7 (A1')


0.247 (NRLMOL)

4.171

91, 92, 109 (Iso.)


0.009 [26]

6.033


0.162 [27]

4.172

83.0 (E’), 94.0 (A1’)


Dooh

0.114 (B3PW91)

4.202

6.7191 (Pu), 56.1543 (Sg),

98.1054 (Su )


0.149 (NRLMOL)

4.200


0.014 [26]

6.403


Ca4

Td

0.444 (B3PW91)

3.767

103.6(E), 122.7(T2), 142.0 (A1)


0.445 (NRLMOL)

3.906

91.0(E), 111(T2), 130.0 (A1)


0.021 [25]

5.345


0.049 [26]

4.233


0.151 [28]

4.286


0.198[29]

4.159


0.199 [30]

4.138


0.341 [27]

4.016

86.0 (E), 105.0 (T2), 127.0 (A1)


Dooh

0.139 (B3PW91)

4.166

4.5 (Au), 4.5 (Bu), 9.3 (Ag)

46.1 (Ag), 82.1 (Bu), 114.0 (Ag)


0.176 (NRLMOL)

4.452


D2h

0.020 (B3PW91)

3.506, 3.921

42.3 (B3u), 77.2(Ag), 98.4 (B2u), 153.4(Ag), 159.1 (B3g), 162.8 (B1u)


0.046 [26]


Ca5

D3h

0.479 (B3PW91)

3.822

69.7(E’), 87.5(E’’), 91.2(A1’), 103.4(A2’’), 132.9(E’), 157.5(A1’)


0.483 (NRLMOL)

4.025

63.0(E), 76(E), 90.0,

102.0, 117.0(E), 145.0


0.142 [26]

5.398

---------------


The pentagonal bipyramid is a possible building block for larger cluster sizes. In fact the lowest energy structure of Ca12 is composed of two of these building blocks with one decorated face, or a tetrahedron unit, and the lowest structure we found for Ca13 is that of two twinned pentagonal bipyramids and a trigonal bipyramid.  An icosahedral-like structure for Ca13 (not a perfect icosahedron) is 0.336 eV above this twinned structure.   The computational effort required for a system of 13 calcium atoms was very large and pushed the computer systems to their limit. Although it has been reported in the literature that the icosohedron structure is the lowest energy structure, I did not achieve that in my calculations. 

For comparison purposes we reproduced the lowest energy geometries of isomers obtained from the MM potential parameterized for calcium [32]. It was found that this potential gives the right geometry of the global minimum structure (but not the bond lengths) of Ca3 through Ca5 and Ca7 through Ca9. However, the lowest-energy isomers obtained with the MM potential for Ca6 and Ca10 through Ca13 were different than those obtained in our work. Additionally, we found that some of the MM lowest-energy geometries are associated to saddle points. Such is the case of Ca6 (Oh).


Figure 3.4a:  Low-energy stable isomers of Ca3 à Ca6.


Figure 3.4b:  Low-energy stable isomers of Ca7 à Ca10.


Figure 3.4c:  Low-energy stable isomers of Ca11 à Ca13.


Table 3.6. Point group, total energy and binding energy per atom, average bond length of stable isomers of Ca1 through Ca13.


Point

Group

Total

Energy (au)

Eb

(eV/atom)

Rmin (Å)

Rave (Å)

Ca


-677.5097839

-----

-----

-----

Ca2

Dooh

-1355.024962

0.0734

4.269

4.269

Ca3

D3h

-2032.553648

0.2204

3.933

3.933


Dooh

-2032.5419513

0.1143

4.202

4.202

Ca4

Td

-2710.1043667

0.4438

3.767

3.767


Dooh

-2710.0596153

0.1393

4.128

4.166


D2h

-2710.0421158

0.0203

3.506

3.589

Ca5

D3h

-3387.6369278

0.4790

3.677

3.822

Ca6

C2v

-4065.1719868

0.5138

3.619

3.852

Ca7

D5h

-4742.7287044

0.6228

3.592

3.805


C2

-4742.7133148

0.5630

3.755

3.851


Cs

-4742.7092276

0.5471

3.697

3.864


C3v

-4742.7008639

0.5146

3.695

3.923

Ca8

Cs

-5420.2657720

0.6378

3.703

3.828

Ca9

C2v

-6097.8153930

0.6874

3.695

3.830


Cs

-6097.8057119

0.6581

3.689

3.829

Ca10

C4v

-6775.3740713

0.7517

3.393

3.868


Cs

-6775.3526570

0.6934

3.726

3.841


Cs

-6775.3400464

0.6591

3.767

3.865

Ca11

D4d

-7452.9113959

0.7515

3.416

3.891


C1

-7452.9037438

0.7326

3.736

3.842

Ca12

C1

-8130.4507797

0.7560

3.672

3.848


Cs

-8130.4471386

0.7477

3.516

3.884


C1

-8130.4448027

0.7424

3.478

3.867

Ca13

C1

-8808.0002736

0.7810

3.660

3.848


~Ih

-8807.9879199

0.7551

3.551

3.934


Figure 3.5:  Binding energy per atom vs. cluster size using B3PW91 (blue) and MM potential (red).


The MM binding energies for all sizes are systematically higher than our results as is illustrated in Fig. 3.5, where the binding energy from MM structures (red are compared to my calculation (blue). Fig. 3.6 shows a comparison of the trend of our average bond distance of the lowest-energy structures as a function of size when compared to those obtained from the MM structures. It is evident that the empirical potential predicts slightly more expanded structures in this size range.  With the exception of Ca4, which is more tightly bound, these averaged bond distances are slowly increasing and will eventually reach the nearest neighbor distance of 3.94 Å of bulk fcc calcium. For a given cluster size this average bond length changes with the symmetry of the isomer, as indicated in Table 3.6.  For bulk matter the energy required to remove one atom is 1.86 eV, which is the heat of vaporization


Figure 3.6:  Average nearest neighbor distances vs. cluster size using B3PW91 (blue) and MM potential (red).


Figure 3.7:  Energy stability of the calcium clusters at zero temperature for the lowest energy structures reported in Table 3.6. The MM potential is in red while the B3PW91 method is in blue.


In Fig. 3.7 I have plotted the second difference of the total energy


                                             (3.9)


where Eb(N) is the binding energy of a cluster with N atoms.  This function is a measure of the relative stability of clusters at zero temperature with respect to their neighboring sizes. Peaks of this function indicate when a cluster with N atoms is relatively more stable than clusters with either N-1 or N+1 atoms. In this size range 4, 7, and 10 display enhanced energy stability at zero temperature when compared to its neighboring structures using the B3PW91 method.  The MM potential had less energy stability.  From Fig. 3.6, I see a periodic behavior in the stability with respect to the number of atoms in the cluster.  


3.4.2               Transition Structures


In the search of the structures with lowest total energy we found several structures associated with saddles of the energy surface (one or multiple imaginary frequencies).  The structures with imaginary frequencies were either transition structures, characterized by one imaginary frequency, saddle points of order 1 or saddle points of order ‘n’, characterized by ‘n’ imaginary frequencies.  The transition structure, or saddle point of order 1, has a maximum energy with a negative curvature in only one direction on the potential energy surface and a minimum, positive curvature, in all other directions.   This type of structure is associated with two minima.   Saddle points with order ‘n’ (with n>1) have a maximum energy in ‘n’ direction with a minimum energy with respect to all other directions.  The structures are associated with 2n minimum energy structures [43].   The transition and saddle point structures are listed in Table 3.7, with their corresponding point group classification, absolute energy value, and binding energy.  The number in parenthesis next to the binding energy is the order of the saddle point, or the number of imaginary frequencies.  The geometry of the structures is shown in Fig. 3.8a and 3.8b.

These structures are interesting because they might be good candidates for intermediate structures in isomerization reactions.  It is found that the lowest energy transition structure for all the calcium clusters listed in Table 3.7, with the exception of Ca10 and Ca12 has one imaginary frequency and is classified as transition structures. A closer examination of transitions structures listed in Table 3.7 for Ca4, Ca5, and Ca6 reveals that the minimum energy structure associated with these transition structures is the “global” minimum energy structure listed in Table 3.6, or the lowest minimum energy structure for Ca4, Ca5, and Ca6.  In my investigation of the transition structure and to understand the behavior of the reaction from one structure to the next, I performed an Intrinsic Reaction Coordinate (IRC) calculation [44,45].  The output of the calculation is the reaction coordinate, the optimized energy, and the optimized structure at each step along the reaction coordinate.  This type of calculation allowed the structures and the reaction path and energy to be determined for each of the structures.    


Figure 3.8a:  Several structures of Ca4 à Ca7 corresponding to saddle points of the energy surfaces.


Figure 3.8b:  Several structures of Ca8 à Ca13 corresponding to saddle points of the energy surfaces.


Table 3.7:  Binding energy per atom, order of saddle point, and average bond length of structures at saddle points found points found for Ca4 through Ca13 using B3PW91. Parenthesis next to the binding energy indicates order of saddle point.


N

Symmetry

Total

Energy (au)

Eb (eV)

4

D2h

-2710.07694181

0.2572 (1)


D4h

-2710.06146710

0.1519 (2)

5

C4v

-3387.61127334

0.3394 (1)

6

D2h

-4065.16775982

0.4946 (1)


D4h

-4065.15967449

0.4580 (3)


C5v

-4065.15001451

0.4142 (2)


Oh

-4065.13686803

0.3545 (5)


D5h

-4065.13678255

0.3541 (1)


D6h

-4065.09796905

0.1781(6)

7

Cs

-4742.70959380

0.5486 (1)


Oh

-4742.64375180

0.2926 (9)

8

C2v

-5420.25668629

0.6069 (1)


Cs

-5420.25506981

0.6014(1)


D6h

-5420.23734205

0.5411 (1)


D4d

-5420.23488095

0.5327(2)


D4h

-5420.19304190

0.3904 (6)

9

D4d

-6097.7999611

0.6407 (1)


C4v

-6097.79646532

0.6302 (1)

10

C2v

-6775.37392400

0.7514 (2)


D4d

-6775.33306917

0.6401(2)

12

C5v

-8130.44171822

0.7354 (2)

13

C1

-8807.99711443

0.7744 (1)


Figure 3.9: Isomerization reaction paths for Ca5. The intermediate structure is depicted at the barrier point. Energies are relative to the energy of the corresponding reactant. The reaction coordinate is dimensionless.


For example, we have determined the reaction path that connects the energy surfaces of two degenerate Ca5 (D3h) isomers, as in Fig. 3.9. We also found the reaction path in the isomerization of Ca6 (C2v), and Ca7 (C2).  These reaction paths are depicted in Fig. 3.10, and 3.11 where the reported energy is relative to the binding energy of the degenerate minima.  The Arrhenius-type energy barriers in the two isomerization reactions are the difference between the binding energies of the transition structures (C4v for the pentamer and D2h for the hexamer reported in Table 3.7) minus the binding energy of the minimum structures from Tables 3.6.  In the case of the hexamer, the octahedron (Oh) is the stable geometry obtained under several empirical potentials


Figure 3.10: Isomerization reaction paths for Ca6. The intermediate structure is depicted at the barrier point. Energies are relative to the energy of the corresponding reactant. The reaction coordinate is dimensionless.


including the MM potential. We have found that this geometry corresponds to a saddle point of order 5. For larger isomers, various other geometries corresponding to saddles of different orders were detected, as shown in Fig. 3.8a and 3.8b.  The binding energies of these saddle structures (see Table 3.7) allow for determination of the barriers in isomerization reactions. However, these saddles do not necessarily connect the lowest-energy isomer of a given size with another isomer of higher energy. For example, one of the low-energy isomers of Ca7 is Ca6 with one decorated face (C2, two intertwined


Figure 3.11: Isomerization reaction paths for Ca7. The intermediate structure is depicted at the barrier point. Energies are relative to the energy of the corresponding reactant. The reaction coordinate is dimensionless.


trigonal bipyramids with one decorated face). There are three equivalent ways to decorate Ca6 and therefore three equivalent isomers. In order to go from one isomer to the other, the reaction path needs to overcome a barrier of about 0.1 eV. 

3.4.3     Energetics and Vibrational Frequencies


The energy difference between the Highest Occupied Molecular Orbital (HOMO) and the Lowest Unoccupied Molecular Orbital (LUMO) decreases with increasing cluster size from 1.9 for the trimer to 0.8 eV for Ca13 as seen in Fig. 3.12 and 3.13.  This energy gap gives an indication of how metallic the system is, since the Fermi energy lays in it. We conclude that small clusters up to Ca13 are not metallic because the energy gap is an order of magnitude larger than thermal energies attainable in experiments. Fig. 3.12 is a representation of the one-electron energies around this gap. The plot gives a visual description of how the conduction band builds up as a function of size. It is to be noted that the density-of-states of bulk FCC calcium, calculated with equivalent methods [46], indicates that the Fermi level is located in a region of low density almost edging a small gap of 0.029 eV.

Determination of vibrational frequencies and their symmetry identification is a lengthy calculation. It is important to report these frequencies because they can be used in further quasiharmonic analysis of elastic and thermodynamic properties.  These frequencies might also be used to develop model potentials to represent calcium clusters. Tables 3.8 and 3.9 contain the harmonic frequencies of vibration for all the stable isomers reported in Table 3.6.  A pictorial representation of the vibrational spectrum as a function of cluster size is provided in Fig. 3.14. In this figure the height indicates the degeneracy of each frequency and the dashed spikes denote vibrational modes that are infrared inactive. The spectrum becomes denser in the center of the band as the size of the cluster is increased. There is an increase in the range of the vibrational frequency for increasing cluster size, as seen in Fig. 3.15.  In this size range only Ca10 presents a very low-frequency mode.


Figure 3.12:  One electron eigenvalues versus cluster size. Solid lines (blue) are the occupied states and dashed lines (red) represent the virtual states.


Figure 3.13:  Energy difference between the LUMO and HOMO vs. cluster size for the lowest energy isomers.


Figure 3.14:  Normal-mode frequencies of vibration for Ca2 through Ca13. The height of the spikes indicates the degeneracy of the mode.  Red lines are infrared active modes and blue lines are inactive.


Figure 3.15:  Width of the vibrational spectrum for the lowest energy isomers as a function of cluster size.


Table 3.8:  Normal-mode frequencies for the isomers of Ca2 through Ca10 reported in Table 3.6.


N

Sym

Frequency (cm-1)

2

Dinfh

72.2952 (Sg)

3

D3h

98.8219 (E'), 107.7175 (A1')


Dinfh

6.7191 (PU), 56.1543 (Sg), 98.1054 (Su)

4

Td

103.597 (E), 122.708 (T2), 142.0022 (A1)


Dinfh

4.5 (Au), 4.5 (Bu), 9.3 (Ag), 46.1 (Ag), 82.1 (Bu), 114.0 (Ag)


D2h

42.3 (B3U), 77.2(Ag), 98.4 (B2U), 153.4(AG), 159.1 (B3G), 162.8 (B1U)

5

D3h

69.7 (E'), 87.5 (E"), 91.2 (A1'),103.4 (A2"), 132.9 (E'), 157.5 (A1')

6

C2v

48.0 (A1), 68.5 (A2), 69.0 (B1), 86.4 (A1),92.8 (B2), 97.0, 100.0(B2),

100.9,104.1 (B1), 119.1(B2), 124.4 (A1), 157.6 (A1)

7

D5h

74.6(E2"), 77.8(E1'), 95.8(A2"),105.1(E2'), 107.3(E1"),

111.1(A1'),116.8(E2'), 137.6(E1'), 167.8(A1')


C2

41.8(B), 48.1(A), 62.3(A), 82.2, 82.7,91.3(A), 98.7(B), 101.6(A),

105.4(B), 114.8(A),117.9 (B), 123.3, 123.3, 140.9(B), 143.3(A)


Cs

43.3, 43.4, 60.5, 80.7, 80.9, 88.2, 89.7, 89.9, 99.5

105.6, 121.3, 121.4, 127.1, 127.2, 150.0


C3v

12.2(E),51.4(A2),58.0(E),81.3(A1),94.7(E),108.1(E),122.5,122.7,122.7,129.7

156.2(A1)

8

Cs

43.6(A"), 60.3(A’), 70.2(A’), 72.5(A’’), 88.0(A’), 93.4(A’), 94.4(A’’),

99.7(A’’), 101.5(A’),104.9(A’), 107.7(A’), 110.7(A’’), 116.1(A’’),

120.3(A’),121.7(A’), 133.4(A’’), 146.1(A’), 151.9(A’)

9

C2v

48.7(B2), 53.2(A1), 59.0(A2), 80.8(A1), 83.0(B1), 84.3(A2), 87.0(B2), 93.4(A1), 100.6, 100.6, 102.1(A2), 103.9(B1), 108.9(A1),113.1(A1), 115.5(B1), 119.4(B2),

124.6(A2),128.6(A1), 142.8(A1), 149.8(B2), 165.1(B1)


C1

37.1(A’), 49.4 (A’’), 53.7(A’’), 69.5(A’), 75.4(A’), 83.0(A’’), 84.9(A’), 90.4(A’’), 92.4(A’), 100.4(A’), 102.9(A’),104.2(A’’), 111.4(A’), 114.7 (A’’),

120.5, 120.5, 127.3 (A’), 134.8(A’’),136.7(A’), 147.1(A’), 158.2(A’)

10

C4v

10.0(B1), 35.7(E), 68.2(A2), 74.5(E),

75.8(B1), 81.0(E), 89.4(E), 98.3(A1),101.9(B1), 112.2(E), 122.0(A1), 126.2(B1), 126.3(A1),128.8(E), 134.6(B2),197.9(A1), 215.5(E)


C1

38.4, 42.1, 56.9, 61.7, 78.7, 80.8,82.3, 89.2, 91.0, 91.3, 96.9, 97.9, 99.4, 108.1, 109.3, 112.7, 114.5, 116.4, 123.3, 124.7, 135.3, 141.0, 146.6, 153.4


C1

21.5, 26.2, 32.1, 52.8, 63.3, 74.8,75.0, 81.6, 82.6, 86.4, 86.6, 92.6,

95.6, 97.6, 108.3, 110.6, 114.0, 117.7,120.8, 124.8, 127.2, 138.7, 138.9, 150.9


Table 3.9:  Normal-mode frequencies for the isomers of Ca11 through Ca13 reported in Table 3.6.


N

Symmetry

Frequency (cm-1)

11

C4v

 48.7, 48.7, 50.9, 55.8, 56.1, 62.4,62.6, 65.6, 71.3, 71.5, 74.8, 74.9,

77.7, 88.9, 88.9, 102.8, 103.0, 103.1,112.0, 126.0, 128.5, 128.7, 130.8, 130.8,

198.9, 219.4, 219.6


C1

 41.0, 47.2, 52.9, 67.8, 74.4, 81.4, 83.0, 83.9, 88.3, 90.7, 91.0, 95.6, 99.6 103.2, 103.4, 106.6, 109.6, 111.5, 114.3, 117.9, 120.9, 131.8, 138.3, 140.2, 143.6, 147.0, 148.4

12

C1

 43.2, 47.0, 52.9, 59.5, 63.8, 73.8, 80.4, 81.3, 84.6, 86.9, 87.4, 90.3, 94.8, 97.3, 98.6, 100.9, 101.7, 102.6, 104.3, 105.9, 112.4, 117.6, 119.3, 127.8, 131.2213, 136.9, 140.4,147.4, 150.5, 164.8


Cs

16.9, 34.3, 37.0, 42.4, 49.6, 54.4, 60.5, 62.2, 64.2, 73.0, 75.5, 78.7, 81.3, 84.4

88.54, 90.4, 93.7, 104.1, 107.6, 108.9, 116.5, 118.3, 124.4, 125.9, 128.5, 129.8

133.12, 180.1, 209.9, 211.0


C1

25.4, 28.2, 46.5, 57.4, 57.7, 66.4, 69.4, 75.3, 75.5, 80.5, 84.4

87.4, 87.5, 89.3, 94.0, 97.5, 106.5, 107.5, 111.0, 111.9, 112.2

120.6, 129.3, 131.8, 134.0, 136.3, 147.9, 161.7, 173.9, 192.8

13

C1

20.5, 37.3, 51.7, 55.5, 57.0, 64.4, 75.0, 76.3, 82.2

           84.0, 86.3, 89.1, 89.9, 92.8, 93.9, 96.6, 99.0, 101.3

          103.6, 105.4, 107.9, 111.3, 111.7, 117.5, 119.8

        122.8, 128.0, 132.3, 138.9, 144.7, 159.8, 161.9, 180.3


~Ih

23.7, 25.6, 35.0, 35.6, 66.9, 67.2, 67.5, 68.0, 68.2, 68.7, 70.8, 71.2

72.7, 83.0, 89.4, 89.9, 94.5, 94.7, 97.2, 97.6, 115.0, 119.2, 119.4

122.9, 124.4, 124.4, 130.3, 132.8, 133.0, 146.4, 147.4, 187.3, 187.7


3.4.4   Thermodynamic Properties and Structural Transitions


A harmonic approximation of several thermodynamic functions was obtained based on the normal-mode frequencies of the calcium clusters. For example, the free energy, internal energy, and vibrational specific heat were calculated for all the known isomers reported in Tables 3.6 of Ca3 through Ca13. 

To calculate the various thermodynamic properties, we begin by defining the partition function in the canonical ensemble for a collection of independent harmonic oscillators with frequency wj


                                                  (3.12)


where ‘k’ is the Boltzmann constant, T is the temperature of the system, U0 is the potential energy of the system of N atoms in equilibrium, and wj are the frequencies of the 3N-6 normal modes of vibration.  Taking the natural logarithm of Q we have


                      (3.13)

The Helmholtz energy (A), internal energy (E), entropy (S), and vibrational specific heat (Cv) are defined in terms of the partition function in the following equations:


                                                 (3.14)


                                                 (3.15)


                                                   (3.16)


                                       (3.17)


These are the equations that will be used in the thermodynamic analysis of calcium clusters.  All the quantities are functions of the logarithm of the partition function, and the vibrational frequencies are determined from the optimized cluster geometries using B3PW91/6-311g(d).

I found that the second to the lowest energy isomer of Ca12 (Cs) becomes more stable at a transition temperature (TS) of 317 Kelvin. The structural transition temperature is defined as the temperature where two of the three curves in the free energy plot for the Ca12 isomers cross, as in Fig. 3.16.   The figure depicts the free energy of these three isomers as a function of temperature and the crossing point where the transition occurs. Additionally, we calculated the internal energy and the specific heat for Ca12. Fig. 3.17 shows the behavior of these quantities at temperatures near TS. In producing these two plots a broadening algorithm was used to smooth the abrupt change of both E and Cn at the transition temperature. Below TS the decorated twinned pentagonal bipyramid structure is preferred, and above TS the decorated anticube


Figure 3.16:  Free energy of the minimum energy structures for Ca12 vs. temperature.  Blue represents the lowest energy cluster at 0 K, red is the second from the lowest, and green is the third from the lowest at 0 K.


structure prevails. Notice that there is no temperature driven transition to the third-to-lowest isomer (incomplete icosahedron) within the harmonic frequency approach. This would mean that the icosahedral growth is not favored by temperature, but instead elements of cubic symmetry that span around a central atom (Ca10 through Ca12) are more favorably enhanced at temperatures slightly above room temperature.


Figure 3.17:  Upper figure is a plot of the internal energy near the structural transition temperature and the lower figure is a plot of the specific heat near the structural transition temperature.


3.6        Conclusion


In this chapter I have presented an analysis of small calcium clusters up to Ca13 using the hybrid DFT approach that includes HF representation of the exchange energy and local and non-local correlation energy functionals provided by Perdew-Wang. We have determined the structure, binding energies, and harmonic frequencies of vibration for several isomers at each cluster size up to Ca13.  The lowest-energy structures of Ca6 and Ca10 through Ca13 had not been reported before as global geometries for calcium clusters.

I predict that there are two paths of cluster growth. At a temperature of almost 0 K, clusters grow by twinning pentagonal bipyramids as the building block, while at temperatures closely above room temperature, clusters grow building shells of atoms around a central atom with local cubic symmetry. For Ca12, instead of the icosohedron-minus-one-atom expected structure, I found that this structure is not reachable within the temperature range studied here (below 500 K).  The Ca12 lowest-energy isomer is a structure with two twinned pentagonal bipyramids that has a decorated face.  I also found that this isomer undergoes a structural transition at about 317 K and becomes an isomer with local cubic symmetry elements as depicted in Fig. 3.17 (Cs because of slight distortions). The metallic character of calcium is far from being attained at Ca13 because the HOMO-LUMO energy difference is 0.8 eV, a value that is very large when compared to the small gap of 0.03 eV observed in bulk FCC calcium.

The average nearest-neighbor interatomic distances for calcium clusters with

N = 4 vary between 3.82 and 3.89 Å, just slightly less than the 3.92 Å found in the FCC crystal. Calcium is a very reactive element and combines readily with oxygen. Therefore studies of pure calcium clusters are challenging systems for experimental findings. In this direction the predictive content of this paper should be helpful. The energy barriers of various isomerization reaction paths are reported, indicating that for very small clusters, these reactions will not take place at room temperature, favoring instead oxidation mechanisms.

Table of Contents

Home Page