Will Climate Change Ever Change the Political
Climate?
Dr. Jeffrey W. Mirick
Part 2: The Planet
The EPA: In the 1960s there
were several environmental disasters that included the Cuyahoga River fire, the New
York City Thanksgiving Smog, and the Santa Barbara oil spill. The fire on the Cuyahoga River was caused by
oil, chemicals, and other pollutants in the river. Incidents like these had been happening for
years. In response to these events,
President Nixon created the Environmental Protection Agency (EPA) to protect human and environmental health. In the 1970 State of the Union he said
The great question of the seventies is, shall we
surrender to our surroundings, or shall we make our peace with nature and begin
to make reparations for the damage we have done to our air, to our land, and to
our water?
Restoring nature to its natural state is a cause
beyond party and beyond factions. It has become a common cause of all the people
of this country. It is a cause of particular concern to young Americans,
because they more than we will reap the grim consequences of our failure to act
on programs which are needed now if we are to prevent disaster later.
With
the establishment of the EPA, regulations were in place to prevent the dumping
of pollutants and chemicals into the rivers and atmosphere. In 2014 the Supreme Court ruled that the EPA
does have the power to regulate carbon dioxide emissions from power plants and
other factories. In 2015 President Obama
instituted the Clean Power Plan that would limit carbon
emissions from existing and new power plants, which was first proposed by the
EPA.
In 2019
President Trump replaced the “Clean Power Plan“ with “Affordable
Clean Energy.” Unfortunately, President
Trump’s plan effectively undoes or weakens many of Obama’s environmental
regulations. The scientists, who were
making recommendations on environmental and human health issues for the EPA
were replaced by businessmen and chief executive officers and the once-environmental
and human-health mission of the EPA changed to a mission that favors polluters,
big oil companies, and coal fire power plants over human and environmental
health. How quickly we forget the
mistakes of the past. The fact that the
political leaders are still debating a course of action for global warming
shows how far we have come since 1970.
Greenhouse gases: The most abundant greenhouse gas is water –
the second most abundant is carbon dioxide.
The abundance of water vapor in the atmosphere adds to the warming of
the planet. As the temperature of the
planet warms, so will the abundance of water in the atmosphere, which in turn
will increase the rate of global warming.
It is a never-ending climate feedback loop.
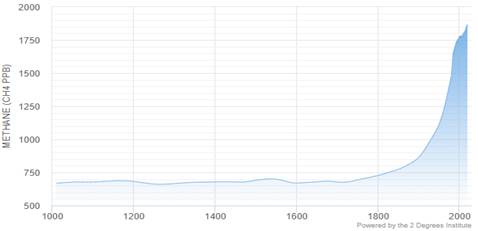
The third most abundant greenhouse gas is methane, which is a
stronger infrared absorber than carbon dioxide.
Some of the sources of atmospheric methane includes fossil fuel
production, livestock, landfills and waste, biomass burning, etc. The methane
plot [2,3] shows the trend in atmospheric methane for the past thousand
years. The concentration of methane in
the atmosphere has not been as high as 2019 levels (1850 ppb) for at least a
million years. As seen in the plot the
methane concentration levels began rising in the late 1800s, as a result of the
industrial revolution. Although methane
has a smaller atmospheric concentration than carbon dioxide, it is a stronger
infrared absorber and will speed up the warming of the climate. The plot shows how the atmospheric
concentration of methane has changed over the past 1000 years.
Forests
and Oceans: What do oceans and forests (trees and all
types of vegetation) have in common? They
both absorb atmospheric carbon dioxide. The
forests absorb nearly 28% of all carbon dioxide emissions while the oceans
absorb another 26%. The remainder, about
50%, of all carbon dioxide emissions stays in the atmosphere.
Deforestation
and fires are the two greatest threats to rain forests. When there are fires in the rainforest,
carbon dioxide is released back into the atmosphere. Where there is deforestation, the size of the
rainforest is reduced, which in turn results in less carbon dioxide being removed
from the atmosphere. The Amazon rainforest
typically produces between 5 and 10 % of the oxygen in the planet’s atmosphere
– which is contrary to the 20% figure that has been stated in many of the news
articles. However, the good news is
that the oxygen concentration in the atmosphere is pretty stable and is not
influenced too much by the fires and deforestation in the Amazon
rainforest.
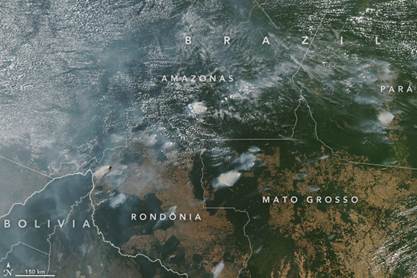
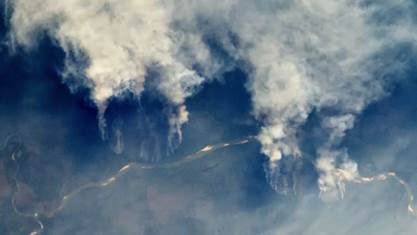
The biodiversity of the Amazon
rainforest is also under attack due to the massive fires this year, which will affect
everyone. Up to 1 million of the
estimated 8 million plant and animal species on Earth are at risk of
extinction, according to the nearly 150 scientists and researchers who produced
the report. They found nature is
declining globally at rates unprecedented in human history [4]. The Moderate Resolution Imaging
Spectroradiometer (MODIS) on NASA’s Aqua satellite captured
these images of several fires burning in the states of Rondônia, Amazonas,
Pará, and Mato Grosso on August 11 and August 13, 2019 [5].
During the
process of photosynthesis, a process that is used by plants, trees, and
other vegetation, water plus carbon dioxide plus sun light is combined to
produce sugar (in the form of glucose) and oxygen. The carbon dioxide in this process is
absorbed and stored by the trees and other plants. An argument used by some climate change
skeptics and politicians is that more carbon dioxide is beneficial to plant
growth, which in turn would produce better crops and forests, and absorb more carbon
dioxide. Although there is some degree
of truth to this, it will not last indefinitely. The limitation will depend on water and
nitrates in the soil and vegetation stress that comes about due to droughts and
heat stress. On average one acre of trees
and vegetation can absorb about 2.5 tons of carbon dioxide annually [6].
The oceans
absorb about a quarter of all carbon dioxide emissions, but as the ocean
absorbs carbon dioxide, the oceans also become more acidic. Some creatures are able to adapt to the
changing ocean chemistry, while other creatures fail to adapt. As the ocean warms, the coral becomes
stressed and loses algae. Algae is a
source of food for the coral and without algae the coral turns white and is
more vulnerable to diseases. This
condition is known as bleached coral. If it is prolonged, the coral will eventually
die. This has been seen happening in the
Great Barrier Reef in the waters off of Australia.
Solar Minimum: The total
radiation output of the sun oscillates between periods of low activity (with
few to no sun spots) and periods of high activity (with several sunspots). This oscillation of the solar output is
brought about by the reversal of the sun’s magnetic field every 11 years. The last solar maximum was expected to be in
2013, but there was little solar activity and fewer sunspots. A prolonged solar minimum could result in
some slowing of global warming, but so far there is no evidence of this in the
data. The last prolonged solar minimum,
the Maunder Minimum, from 1645 to 1715, also corresponded to a “little ice age”
where much of North America and Europe had much colder temperatures and global
temperatures dropped by 1.3oC (2.3oF).
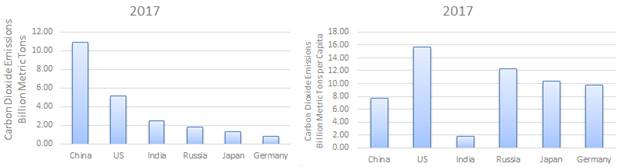
Carbon Dioxide
Emissions by Country: As seen in the bar charts for the year 2017,
the country responsible for the largest carbon dioxide emissions is China at
about 11 billion metric tons, followed by the United States at about 5 billion
metric tons, and India at about 2.5 billion metric tons. But if we break down the emissions by
population, it is the United States that emits more carbon dioxide per person
than any other country, followed by Russia, Japan, Germany, and then China, and
India, as seen in the right chart below for 2017. The United States is a significant
contributor to carbon dioxide emissions per person and the United States needs
to play a major part of any global plan to address global warming.
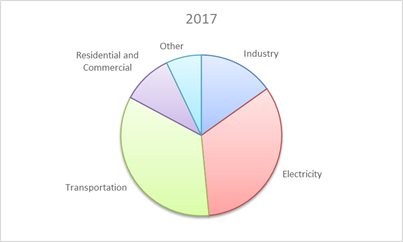
Carbon Dioxide
Emissions by Source and by Type: From
the pie chart, power generation and transportation are equally responsible for
about two thirds of all greenhouse gas emissions (mostly carbon dioxide). Cement production is also major source of
carbon dioxide emissions in industry. Coal burning power plants account for about
one third of carbon emissions and are responsible for about 0.3oC (0.5oF)
temperature rise since 1880. The
temperature increase from all sources is estimated to be 1oC (1.8oF).
The Planet: Everything that makes life possible on Earth is contained within
the planet’s biosphere – which includes the oceans, the land, the troposphere, the
stratosphere, all the way to the exosphere and the Earth’s magnetic
fields. The troposphere contains 80 to
90% of the Earth’s atmosphere, which extends outward from the planet’s surface
to an altitude of 10 kilometers. The
troposphere contains about 78% nitrogen, 20% oxygen, 0.9% argon, .04% carbon
dioxide, and a small amount of other gases including methane. This is the regions where weather patterns
are formed.
President Trump, as he frequently does, mocked global
warming. In response to the tremendous
amounts of snow and near record setting cold temperatures earlier this year he
tweeting
"... Wouldn’t be bad to have a little of
that good old-fashioned Global Warming right now!"
He
has repeated this claim several times. Many
in the GOP and President's Trump’s base actually conflate weather (or polar
vortex) with climate change. If it is repeated enough times than people
will come to believe that global warming
may not be as serious as the scientists make it out to be - BUT it is serious
and has many expected and unexpected consequences -
temperature extremes, warmer oceans, rising oceans, coastal flooding, excessive
melting of ice fields and glaciers, stronger storms, wildfires, droughts, threat
to agriculture, wildlife, public health, and local conflicts fighting over
resources and territories are all consequences of a warming climate. We see the
warming of the climate in the data and we see the effects of a warming climate
on the planet.
During
the summer, the United States experienced record high temperatures throughout
the country. As pointed out by numerous
sources, weather is the short term (day to day) state of the atmosphere while
climate is the average state of the atmosphere over a much long-term period of
time (often years). Climate change
describes how the atmosphere is changing year to year over several years. The fact that each year the planet is
experiencing new temperature extremes is an indication that the climate is
changing.
Greenland
Ice Sheets:
The largest island in the world is Greenland, which is approximately the
size of Alaska and has an ice sheet that covers 80% of its land (Antarctica and
Australia are considered continental land masses). The ice sheet of Greenland is the second
largest in the world – Antarctica being the first – with an average thickness generally
more than 2 km (1.2 miles) and a maximum thickness of about 3 km (1.9
miles). Typically, during the winter
season snow accumulates on the icefield and during the summer months not all
the snow melts. The remaining snow left
after summer becomes part of the icefield and there is a net gain of ice and
the ice sheet grows thicker. The
temperature on the ice sheet is generally between -31oC (-23.8oF)
in the north central region and -20oC (-4oF) in the
southern regions. Typically, the
temperatures stay well below the freezing point on the ice fields, but on
August 1st, 2019, the temperature rose above the freezing
point. From July 30th to
August 3rd 2019, 55 billion tons of cold fresh water from the
melting of Greenland’s ice sheets were dumped into the ocean, which was 40
billion tons more than the average water runoff from 1981 to 2010. On August 2nd, 2019 Greenland lost
12.5 billion tons of ice, which is the largest “single day” loss in recorded
history. This was driven primarily by
the hot days in Europe in July 2019. If
the entire icefield in Greenland was to melt, it is estimated the ocean level
would rise by approximately 20 feet, which will cause major flooding in all
coastal areas around the world. Since 1960 the ocean levels have risen about 5
inches, and about half of that is attributed to the ice sheet melting of
Greenland. Miami is about 6.5 feet above
mean sea level.
Satellite
measurements from NASA’s Gravity Recovery and Climate Experiment (GRACE) and
global positioning system (GPS) stations in Greenland have indicated that from
2003 to mid-2013 the net ice melt in Greenland has increased. For the next 12 to 18 months (2013 to 2014)
there was very little ice loss [7]. By
2015 the ice loss had accelerated again at an alarming rate and has continued
to this day due to the warming of the climate. This, in turn, will cause the
ocean levels to rise, resulting in greater coastal flooding as the icefield
continues to melt.
The Arctic:
The temperatures in the Arctic range
from -34oC to 0oC (-29oF to 32oF)
in January and can drop below -50oC (-58oF), while the
average July temperature ranges from -10oC to 10oC (14oF
to 50oF). The Arctic sea is
bordered by land (Alaska, Finland, Northern Canada, Island, Norway, Russia, Sweden,
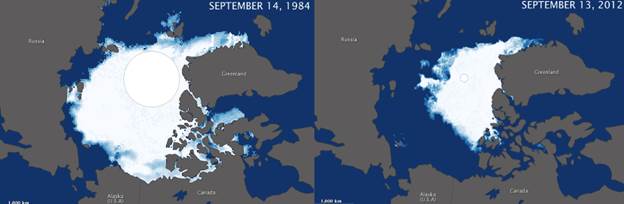
Iceland, and Greenland). The Arctic sea
ice grows in size during the winter months and shrinks during the summer months
and the physical extent of the ice even changes from year to year. However, on average, scientists have seen the
Arctic ice get smaller when comparing the physical extent of the sea ice in
September 1984 with the size in September 2012, as seen in the figure. The sea keeps the temperatures in the Arctic
slightly warmer when compared to Antarctica.
Ice loss in the Arctic Is a function of “natural climate variability and
anthropogenic warming caused by increased atmospheric carbon dioxide
concentrations” [8,9]. Some models predict
that the Arctic sea ice will be gone by the end of the century. The warming of the Arctic is about twice as
fast as the rest of the planet. Polar Bears, Arctic wolves, Arctic fox, Pacific salmon, and Seals
all live in the Arctic. The changing
habitant and a warming climate are threats to their survival.
One
Planet: As stated earlier, everything that makes life
possible on Earth is contained within the planet’s biosphere – which includes
the land, the oceans, and the atmosphere.
Some species will adapt to the changing climate while others will go
extinct and be lost forever. This in turn,
will be felt up the food chain where some species feed on others. Inaction is not a solution to global warming
- empathy is needed. The data, the
changes in the planet, and the science points to one conclusion. Make no mistake, climate change is happening
and the burning of fossil fuels, coal, deforestation, and development in rain
forests n are the principle culprits! The
accumulation of carbon in the atmosphere causes the climate to warm and human
activity is pumping nearly 50 billion tons of carbon into the atmosphere each
year! The choice is to pay now or pay more later in
terms of lives lost and money. References
10 to 18 lists other sources of information that details some of the consequences
of global warming.
In
the 1940s it took five years for the United States to develop the world first
atomic bomb. In the 1960s it took the
United States seven years to send man to the moon and return him safely to
Earth. The United States has the
capability to solve the problem of global warming. The main obstacle is the political will to do
anything about it - President Trump refuses to participate in climate change
talks at the G7 summit, has withdrew from the Paris Climate Accords, and
continues to mock and presents misinformation on climate change. Part 3 of the series on climate change will
include solutions and what can be done to mitigate the impact of climate
change.
1.)
http://old.grida.no//climate/vital/index.htm
2.)
https://www.climatelevels.org
3.)
https://www.methanelevels.org/#sources
4.)
https://www.ipbes.net/news/Media-Release-Global-Assessment
5.)
https://earthobservatory.nasa.gov/images/145464/fires-in-brazil
6.)
http://urbanforestrynetwork.org/benefits/air%20quality.htm
7.) Michael
Bevis, Christopher Harig, Shfaqat
A. Khan, Abel Brown, Frederik J. Simons, Michael Willis, Xavier Fettweis, Michiel R. van den Broeke, Finn Bo Madsen, Eric Kendrick, Dana J. Caccamise II, Tonie van Dam, Per Knudsen, and Thomas Nylen, Accelerating changes in ice mass within Greenland,
and the ice sheet’s sensitivity to atmospheric forcing, PNAS February 5, 2019
116 (6) 1934-1939
8.)
https://www.scientificamerican.com/article/when-will-all-the-ice-in-the-arctic-be-gone/
9.)
Assembled
from NASA Earth Observatory images by Jesse Allen, using data from the Advanced
Microwave Scanning Radiometer 2 AMSR-2 sensor on the Global Change Observation
Mission 1st-Water (GCOM-W1) satellite. - http://earthobservatory.nasa.gov/IOTD/view.php?id=79256
10.) NOAA (National Oceanic and Atmospheric Administration). 2016.
Laboratory for Satellite Altimetry: Sea level rise. Accessed June 2016.www.star.nesdis.noaa.gov/sod/lsa/SeaLevelRise/LSA_SLR_timeseries_global.php.
11.) The international Energy Agency, Global Energy and CO2 Status
Report, https://www.iea.org/about/
12.) Report of
The Environmental Pollution Panel President's Science Advisory Committee, Theh White House, November 1965
13.) United States Global Change
Research Program, Fourth National Climate Assessment Vol I + II - completed in November 2018
14.) United Nations Climate Change Annual Report
2017
15.) The Intergovernmental
Panel on Climate Change (IPCC) (https://www.ipcc.ch)
16.) Report on Effects of a Changing
Climate to the Department of Defense, January 2019 https://climateandsecurity.org/2019/01/18/new-pentagon-report-the-effects-of-a-changing-climate-are-a-national-security-issue/
17.) Paris Climate Agreement, United Nations, 2015